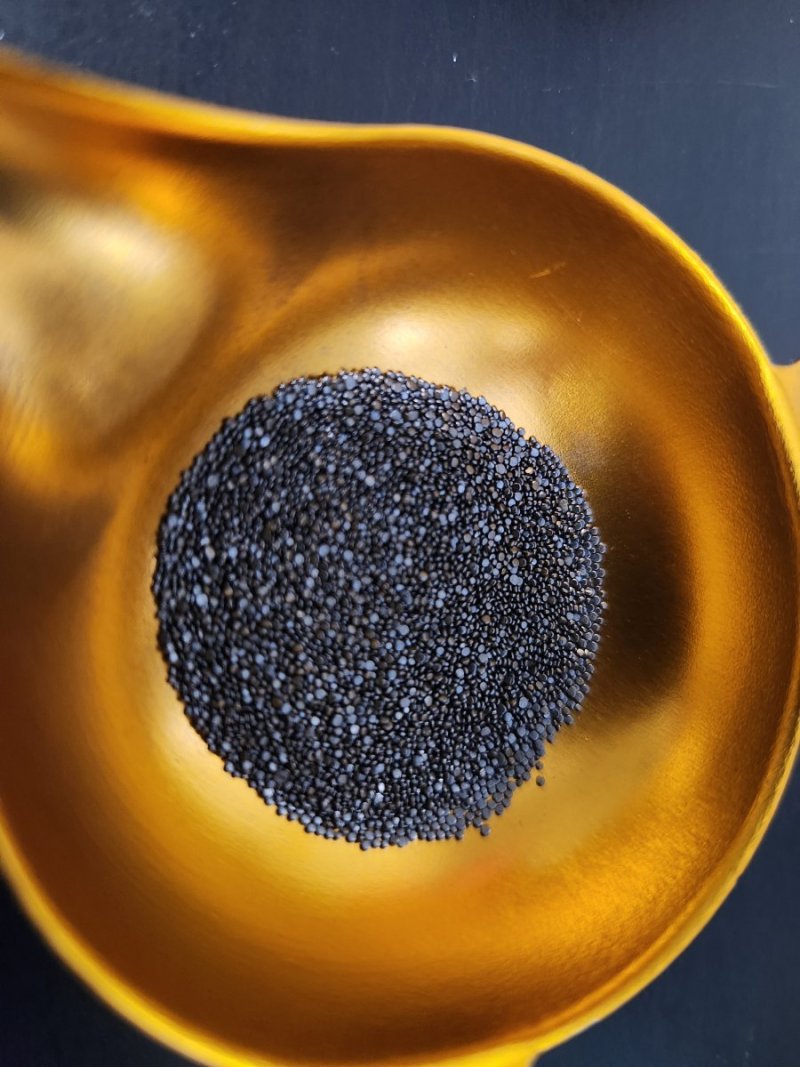
I made one of these a while back for h110. I use a lot of that powder for 357, 44, and 500
It's handy if you have a really good metering powder you use across a broad spectrum of calibers or bullet weights in the same caliber you are working up a load for. Saves a lot of guessing and adjustments. You can use the slope intercept formula your high school math teacher taught you and basic algebra to arrive at a very accurate adjustment for your meter.

It's handy if you have a really good metering powder you use across a broad spectrum of calibers or bullet weights in the same caliber you are working up a load for. Saves a lot of guessing and adjustments. You can use the slope intercept formula your high school math teacher taught you and basic algebra to arrive at a very accurate adjustment for your meter.